Asia Finance
Asia Finance
Asia Finance
Asia Finance
Asia Finance
The mission of Asia Finance, a fintech start-up, was to educate and empower people with better financial literacy. The main product was a content platform pushing out articles on various financial topics for the masses.
The mission of Asia Finance, a fintech start-up, was to educate and empower people with better financial literacy. The main product was a content platform pushing out articles on various financial topics for the masses.
The mission of Asia Finance, a fintech start-up, was to educate and empower people with better financial literacy. The main product was a content platform pushing out articles on various financial topics for the masses.
The mission of Asia Finance, a fintech start-up, was to educate and empower people with better financial literacy. The main product was a content platform pushing out articles on various financial topics for the masses.
The mission of Asia Finance, a fintech start-up, was to educate and empower people with better financial literacy. The main product was a content platform pushing out articles on various financial topics for the masses.
Business objective
Business objective
Business objective
Business objective
Business objective
To retain and increase our following of readers on the content platform.
To retain and increase our following of readers on the content platform.
To retain and increase our following of readers on the content platform.
To retain and increase our following of readers on the content platform.
To retain and increase our following of readers on the content platform.
Relevant metrics:
• Current readers (Baseline): Monthly visitors
• New readers: New monthly visitors
• Retaining readers: Recurring monthly visitors, pages per session, time on page, scroll depth on page, drop-off rate
Relevant metrics:
• Current readers (Baseline): Monthly visitors
• New readers: New monthly visitors
• Retaining readers: Recurring monthly visitors, pages per session, time on page, scroll depth on page, drop-off rate
Relevant metrics:
• Current readers (Baseline): Monthly visitors
• New readers: New monthly visitors
• Retaining readers: Recurring monthly visitors, pages per session, time on page, scroll depth on page, drop-off rate
Relevant metrics:
• Current readers (Baseline): Monthly visitors
• New readers: New monthly visitors
• Retaining readers: Recurring monthly visitors, pages per session, time on page, scroll depth on page, drop-off rate
Relevant metrics:
• Current readers (Baseline): Monthly visitors
• New readers: New monthly visitors
• Retaining readers: Recurring monthly visitors, pages per session, time on page, scroll depth on page, drop-off rate
Research Insights
Research Insights
Research Insights
Research Insights
Research Insights
Based on feedback from usability testing with 10 users and data analysis, we found a few key issues:
Based on feedback from usability testing with 10 users and data analysis, we found a few key issues:
Based on feedback from usability testing with 10 users and data analysis, we found a few key issues:
Based on feedback from usability testing with 10 users and data analysis, we found a few key issues:
Based on feedback from usability testing with 10 users and data analysis, we found a few key issues:
Poor information architecture
Poor information architecture
Poor information architecture
Poor information architecture
Poor information architecture
70% of people found navigation between pages and categories confusing
70% of people found navigation between pages and categories confusing
70% of people found navigation between pages and categories confusing
70% of people found navigation between pages and categories confusing
70% of people found navigation between pages and categories confusing
Limited sharing options
Limited sharing options
Limited sharing options
Limited sharing options
Limited sharing options
Participants struggled to find any sharing function on article pages
Participants struggled to find any sharing function on article pages
Participants struggled to find any sharing function on article pages
Participants struggled to find any sharing function on article pages
Participants struggled to find any sharing function on article pages
Low engagement rate
Low engagement rate
Low engagement rate
Low engagement rate
Low engagement rate
High drop-off rate and low average pages per session (based on Google Analytics)
High drop-off rate and low average pages per session (based on Google Analytics)
High drop-off rate and low average pages per session (based on Google Analytics)
High drop-off rate and low average pages per session (based on Google Analytics)
High drop-off rate and low average pages per session (based on Google Analytics)
Inconsistent components
Inconsistent components
Inconsistent components
Inconsistent components
Inconsistent components
Components had different sizes across pages and not web responsive
Components had different sizes across pages and not web responsive
Components had different sizes across pages and not web responsive
Components had different sizes across pages and not web responsive
Components had different sizes across pages and not web responsive
Restructuring the IA
Restructuring the IA
Restructuring the IA
Open card sorting
Open card sorting
Open card sorting
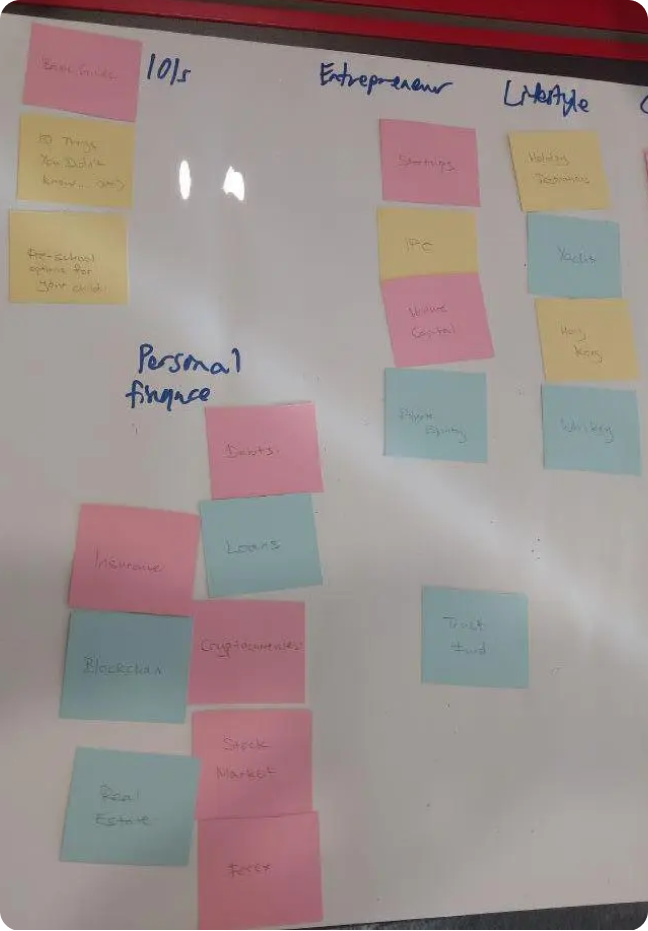
Results from an open card sorting exercise revealed that users found many financial terms on the categories difficult to understand and relate to.
Results from an open card sorting exercise revealed that users found many financial terms on the categories difficult to understand and relate to.
Results from an open card sorting exercise revealed that users found many financial terms on the categories difficult to understand and relate to.
1. Simplifying top category titles into verbs:
Knowledge Vault → Learn
Business Vault → Events
Systematic Investing → Invest
2. New sub-categories based on user input
i.e. Personal Finance, Career, Entrepreneur, etc
1. Simplifying top category titles into verbs:
Knowledge Vault → Learn
Business Vault → Events
Systematic Investing → Invest
2. New sub-categories based on user input
i.e. Personal Finance, Career, Entrepreneur, etc
1. Simplifying top category titles into verbs:
Knowledge Vault → Learn
Business Vault → Events
Systematic Investing → Invest
2. New sub-categories based on user input
i.e. Personal Finance, Career, Entrepreneur, etc
Encouraging article sharing
Encouraging article sharing
Encouraging article sharing
Encouraging article sharing
Encouraging article sharing
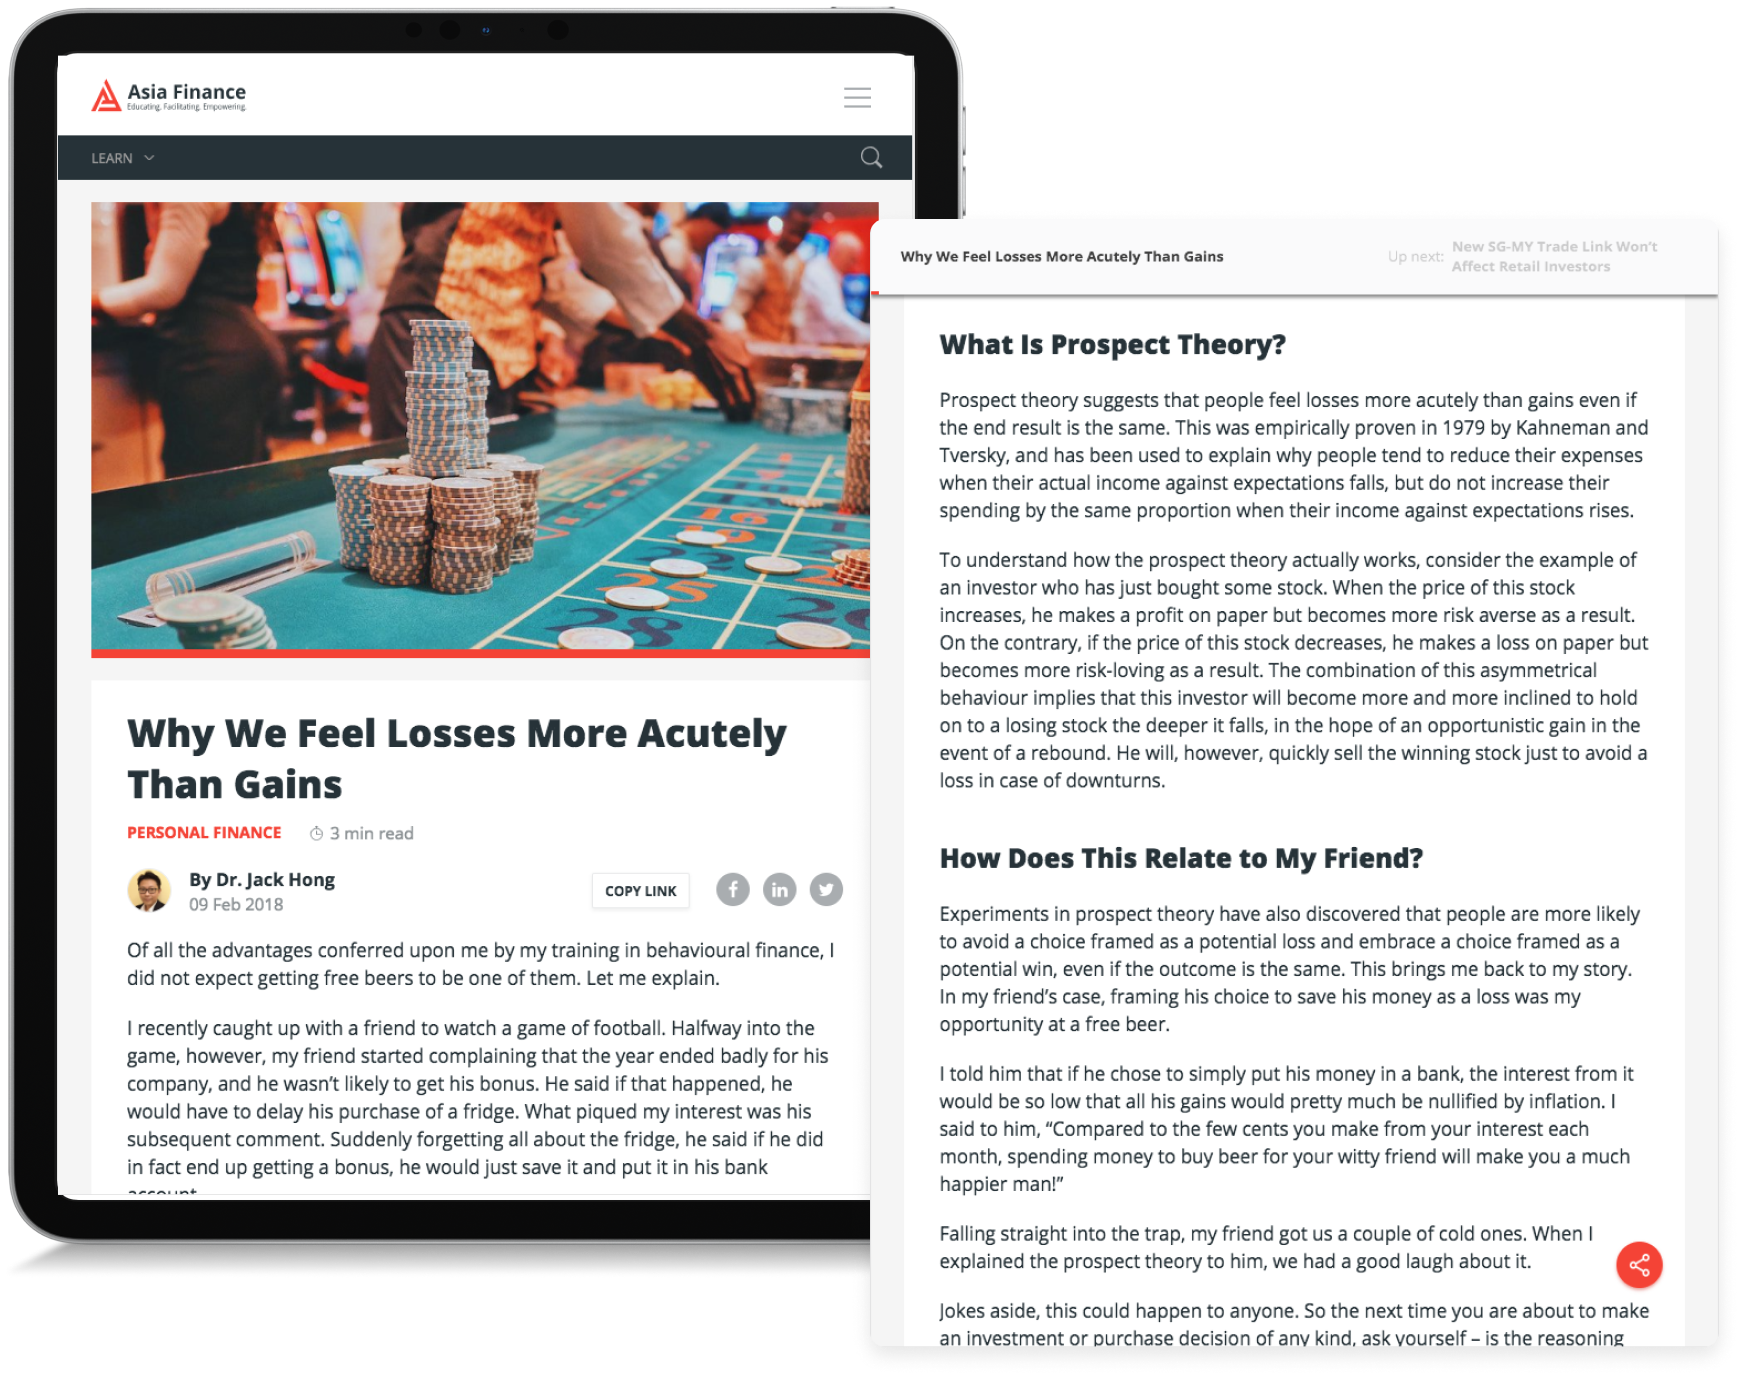
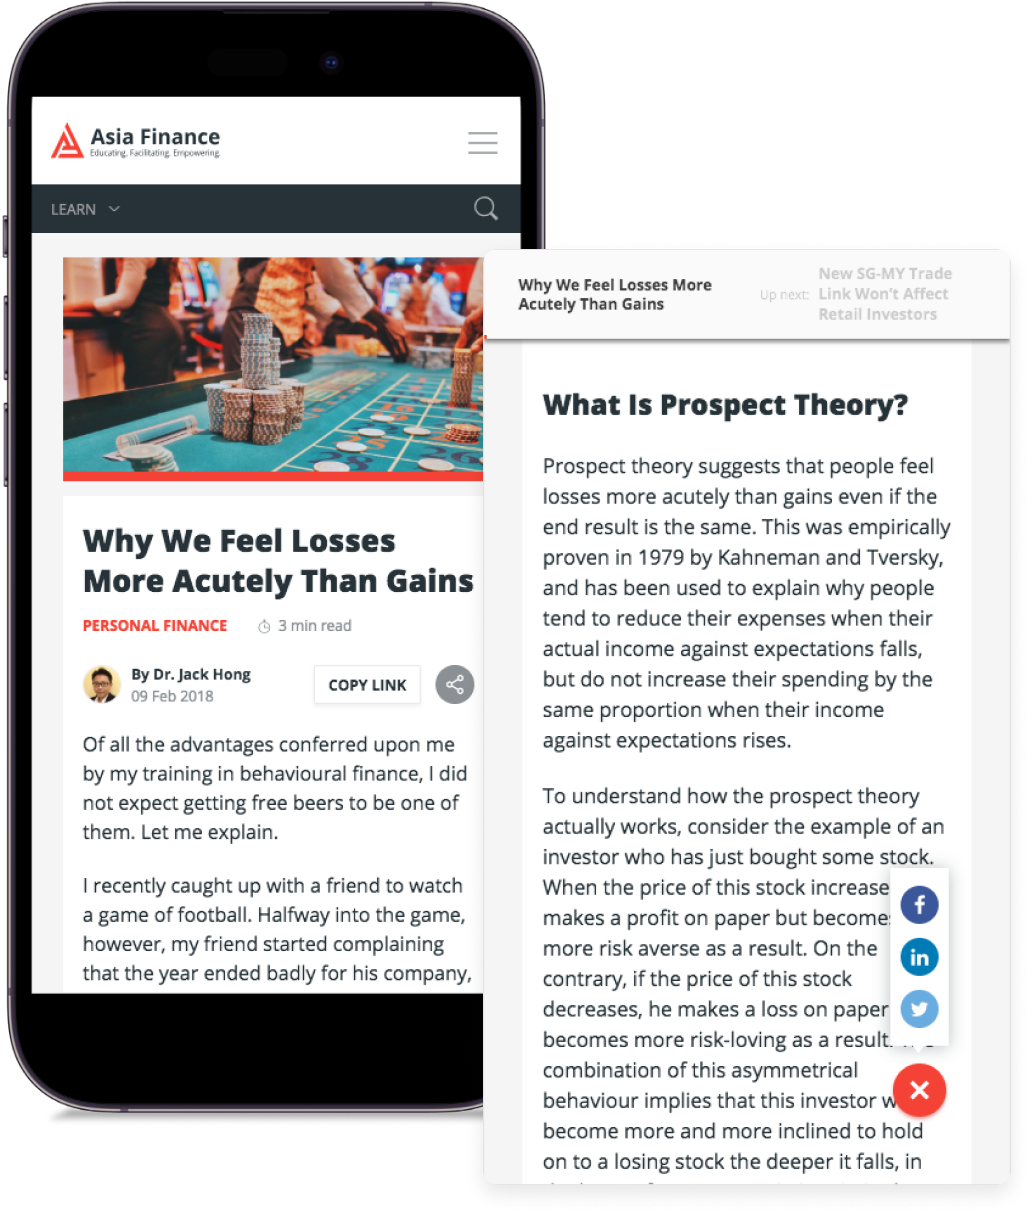
• Added social sharing and copy link buttons to all articles
• A/B testing showed that pages with these added had a 15% increase in visitors
• Copy link button clicks had a direct correlation to more new visitors on page
• Added social sharing and copy link buttons to all articles
• A/B testing showed that pages with these added had a 15% increase in visitors
• Copy link button clicks had a direct correlation to more new visitors on page
• Added social sharing and copy link buttons to all articles
• A/B testing showed that pages with these added had a 15% increase in visitors
• Copy link button clicks had a direct correlation to more new visitors on page
• Added social sharing and copy link buttons to all articles
• A/B testing showed that pages with these added had a 15% increase in visitors
• Copy link button clicks had a direct correlation to more new visitors on page
• Added social sharing and copy link buttons to all articles
• A/B testing showed that pages with these added had a 15% increase in visitors
• Copy link button clicks had a direct correlation to more new visitors on page
Engaging readers
Engaging readers
Engaging readers
Engaging readers
Engaging readers
1. Crafted an algorithm to push recommended articles to users based on cookies and article tags
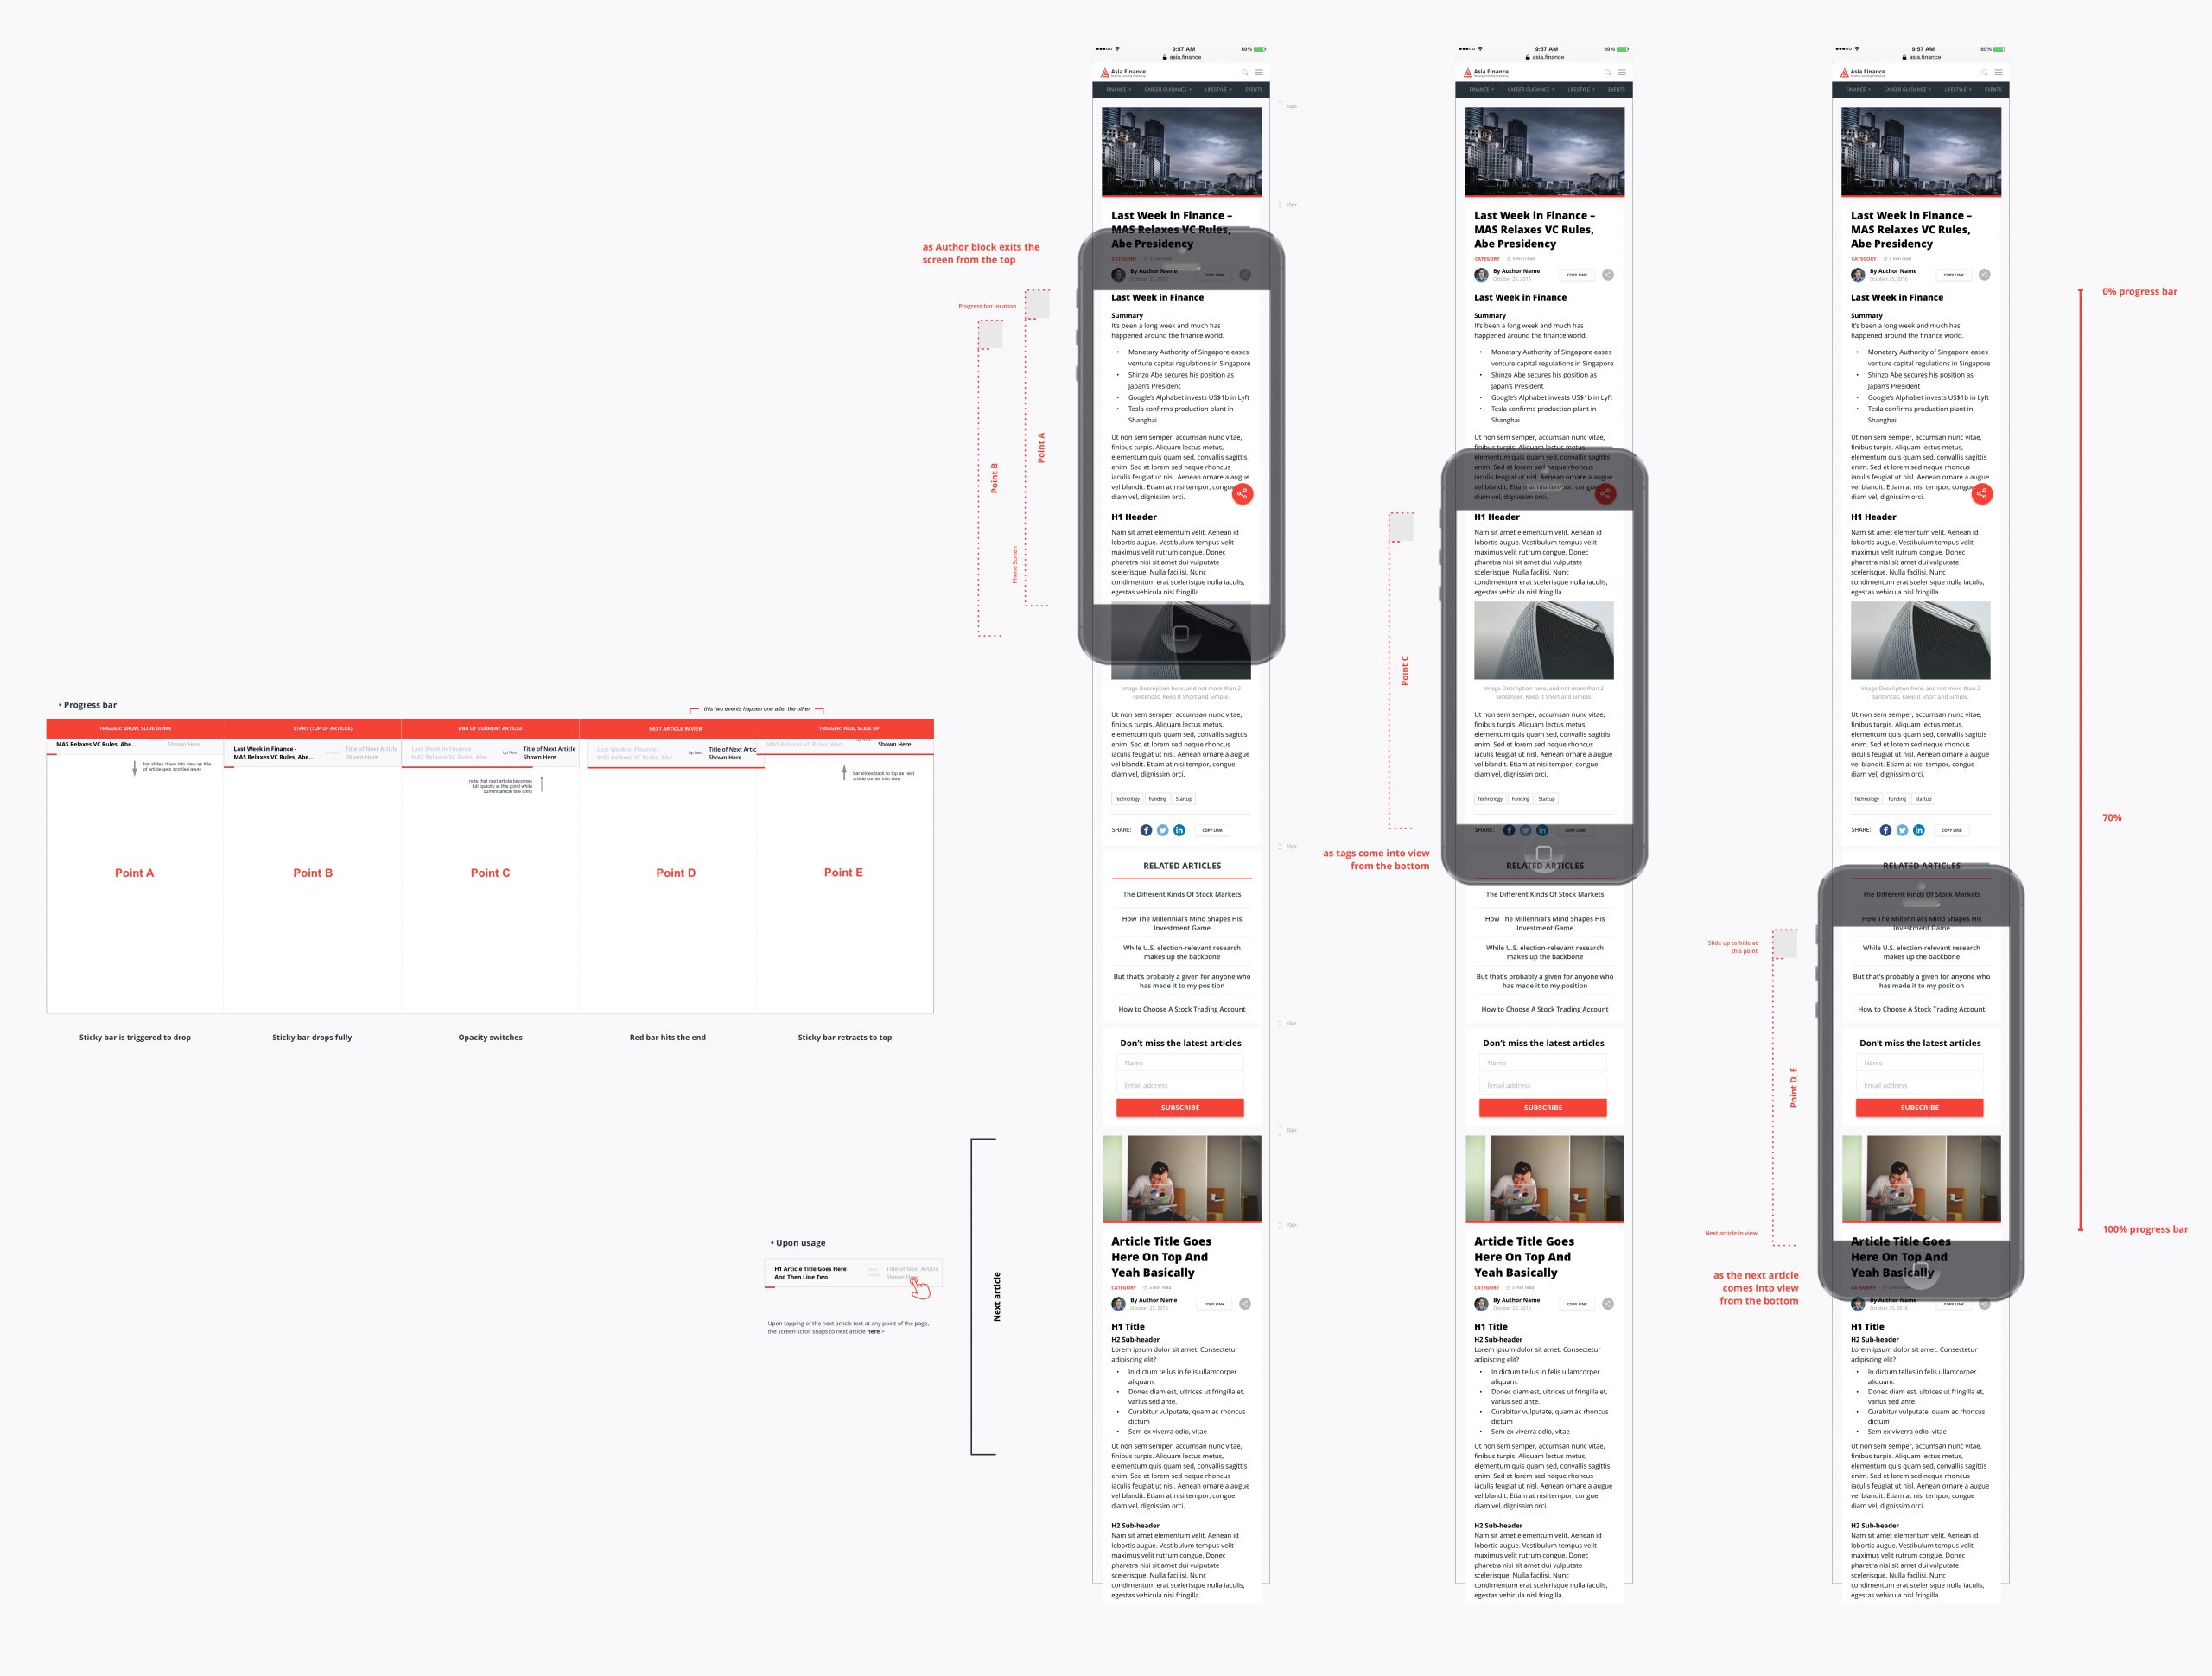
2. Introduced infinite scrolling on articles across all breakpoints
1. Crafted an algorithm to push recommended articles to users based on cookies and article tags
2. Introduced infinite scrolling on articles across all breakpoints
1. Crafted an algorithm to push recommended articles to users based on cookies and article tags
2. Introduced infinite scrolling on articles across all breakpoints
1. Crafted an algorithm to push recommended articles to users based on cookies and article tags
2. Introduced infinite scrolling on articles across all breakpoints
1. Crafted an algorithm to push recommended articles to users based on cookies and article tags
2. Introduced infinite scrolling on articles across all breakpoints
Specifications of design and clickable prototype for developers' reference
Specifications of design and clickable prototype for developers' reference
Specifications of design and clickable prototype for developers' reference
Specifications of design and clickable prototype for developers' reference
Specifications of design and clickable prototype for developers' reference
Consistency across screens
Consistency across screens
Consistency across screens
Consistency across screens
Consistency across screens
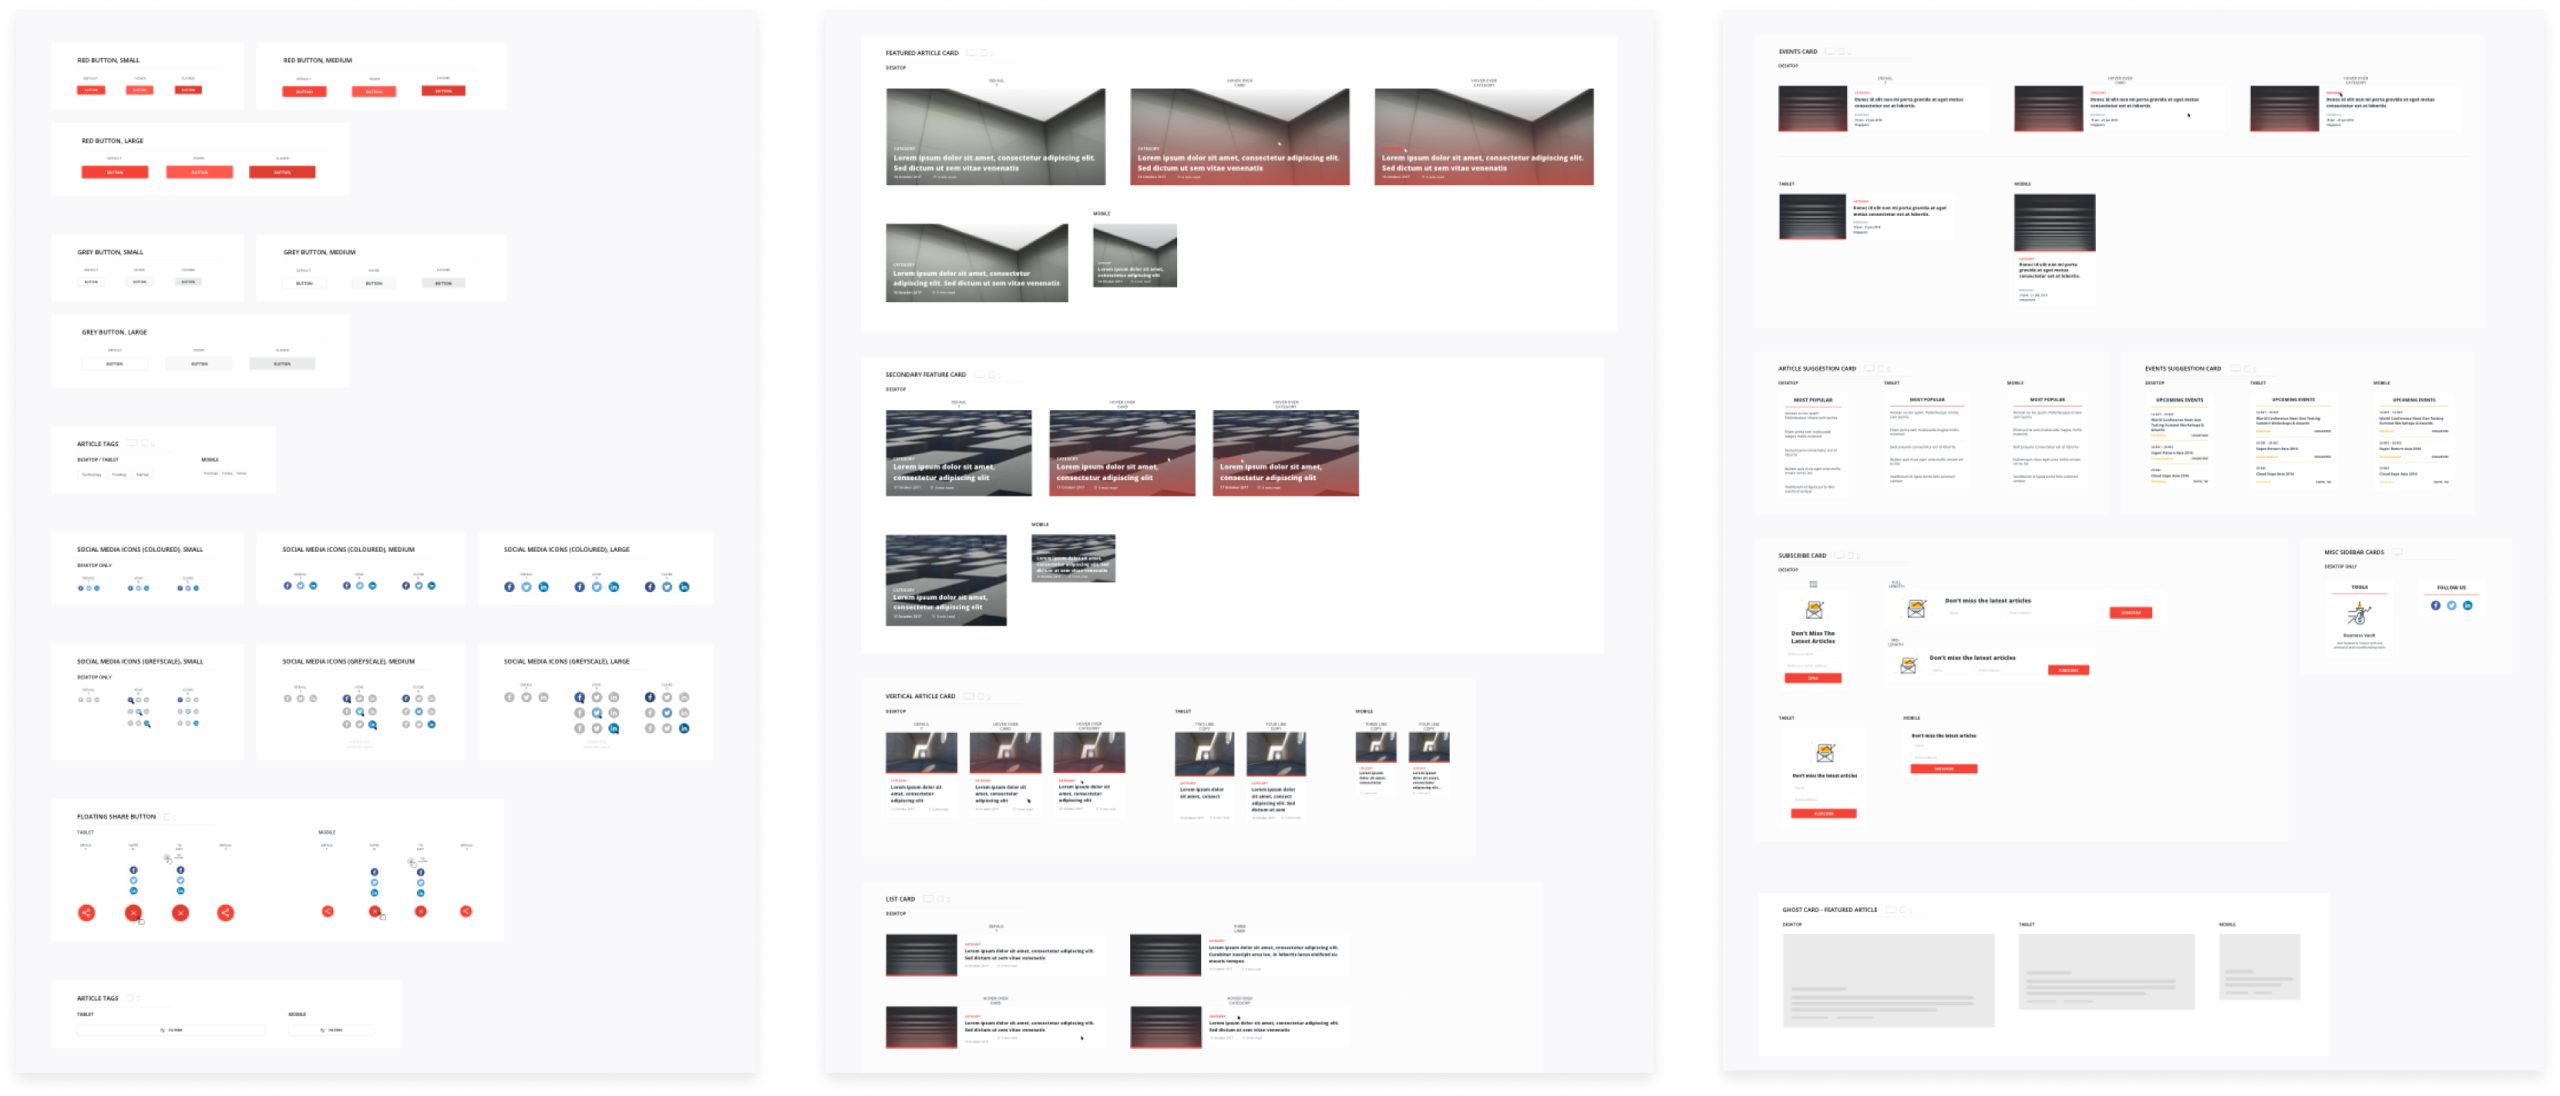
• Created a design component library with specifications for every breakpoint
• Set guidelines for how each component is used
• Uploaded to Zeplin for front-end developers
• Created a design component library with specifications for every breakpoint
• Set guidelines for how each component is used
• Uploaded to Zeplin for front-end developers
• Created a design component library with specifications for every breakpoint
• Set guidelines for how each component is used
• Uploaded to Zeplin for front-end developers
• Created a design component library with specifications for every breakpoint
• Set guidelines for how each component is used
• Uploaded to Zeplin for front-end developers
• Created a design component library with specifications for every breakpoint
• Set guidelines for how each component is used
• Uploaded to Zeplin for front-end developers
Outcome
Outcome
Outcome
Outcome
Outcome
Here are a few of the key metrics within 6 months of the above optimisations:
• Recurring monthly visitors: from approx. 40k to 81k ⬆️
• Avg. pages per session: from 1 to 3 pages per user ⬆️
• Avg. time on page: from 24 seconds to 1 min 16 seconds ⬆️
• Drop-off rate on home page reduced by 14% ⬆️
Here are a few of the key metrics within 6 months of the above optimisations:
• Recurring monthly visitors: from approx. 40k to 81k ⬆️
• Avg. pages per session: from 1 to 3 pages per user ⬆️
• Avg. time on page: from 24 seconds to 1 min 16 seconds ⬆️
• Drop-off rate on home page reduced by 14% ⬆️
Here are a few of the key metrics within 6 months of the above optimisations:
• Recurring monthly visitors: from approx. 40k to 81k ⬆️
• Avg. pages per session: from 1 to 3 pages per user ⬆️
• Avg. time on page: from 24 seconds to 1 min 16 seconds ⬆️
• Drop-off rate on home page reduced by 14% ⬆️
Here are a few of the key metrics within 6 months of the above optimisations:
• Recurring monthly visitors: from approx. 40k to 81k ⬆️
• Avg. pages per session: from 1 to 3 pages per user ⬆️
• Avg. time on page: from 24 seconds to 1 min 16 seconds ⬆️
• Drop-off rate on home page reduced by 14% ⬆️
Here are a few of the key metrics within 6 months of the above optimisations:
• Recurring monthly visitors: from approx. 40k to 81k ⬆️
• Avg. pages per session: from 1 to 3 pages per user ⬆️
• Avg. time on page: from 24 seconds to 1 min 16 seconds ⬆️
• Drop-off rate on home page reduced by 14% ⬆️
